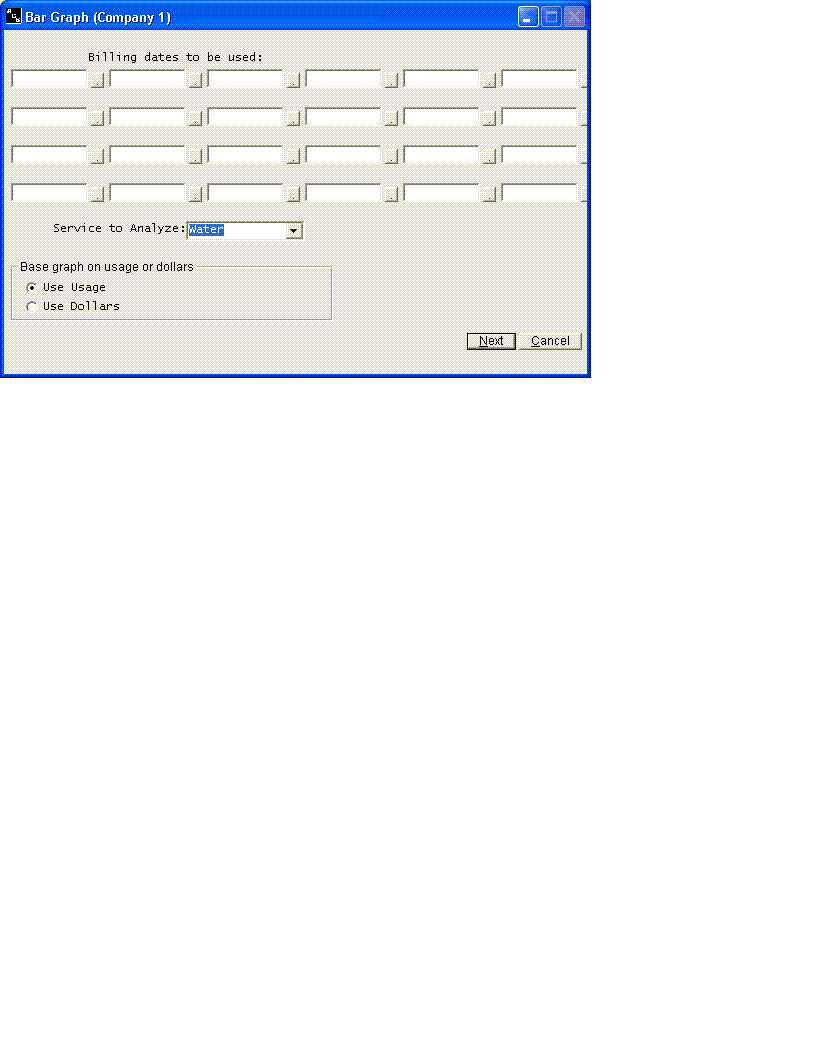
The Bar Graph option will allow you to print a bar graph of the usage or dollars generated by water, sewer, electric or gas services. You can pick any 24 dates to be used. The system will automatically fill in the last 24 billing dates. If you are on cycle billing, you will have to reenter the correct dates. You will also have to reenter the dates if you want anything older than the last 24 months.